
Business Glossary
Since The ReAssembler explores not just technology but also the business and economic ideas behind it, I wanted a place to break down key terms in plain language. No textbooks, no jargon — just short, friendly explanations you can actually use.
This page is your go-to resource for understanding key concepts in a clear, user-friendly way. I’ll regularly update it with new terms, linking them to articles where they’re used, so you can see them in action. Let’s get started!
ROI (Return on Investment)
A way to measure if something was “worth it.” It compares the profit (or benefit) you gained to what you spent to get it. A high ROI means you got a lot back for what you put in; a low ROI means the return was small. ROI isn’t just for money - it can also apply to time, effort, or resources.
Example: If you spend $1,000 on an ad campaign and it brings in $5,000 in sales, your ROI is high.
In the business world, every product, service and even an employee has a ROI value calculated somewhere. It's a simple way businesses check if projects pay off by comparing benefits to costs—higher ROI means smarter spending, helping decide where to put money next.
KPI (Key Performance Indicator)
A measurable sign of progress toward a goal. The KPIs are measurable stats that help track whether a project, team, or company is on the right path. They vary by context — a sales team might track “monthly new customers,” while a website might track “average time spent on page”. So in the real world, every department in the company has different goals, and for each goals we can set KPIs.
Good KPIs are clear, specific, and tied to an objective, so you can tell if you’re succeeding or need to change course.
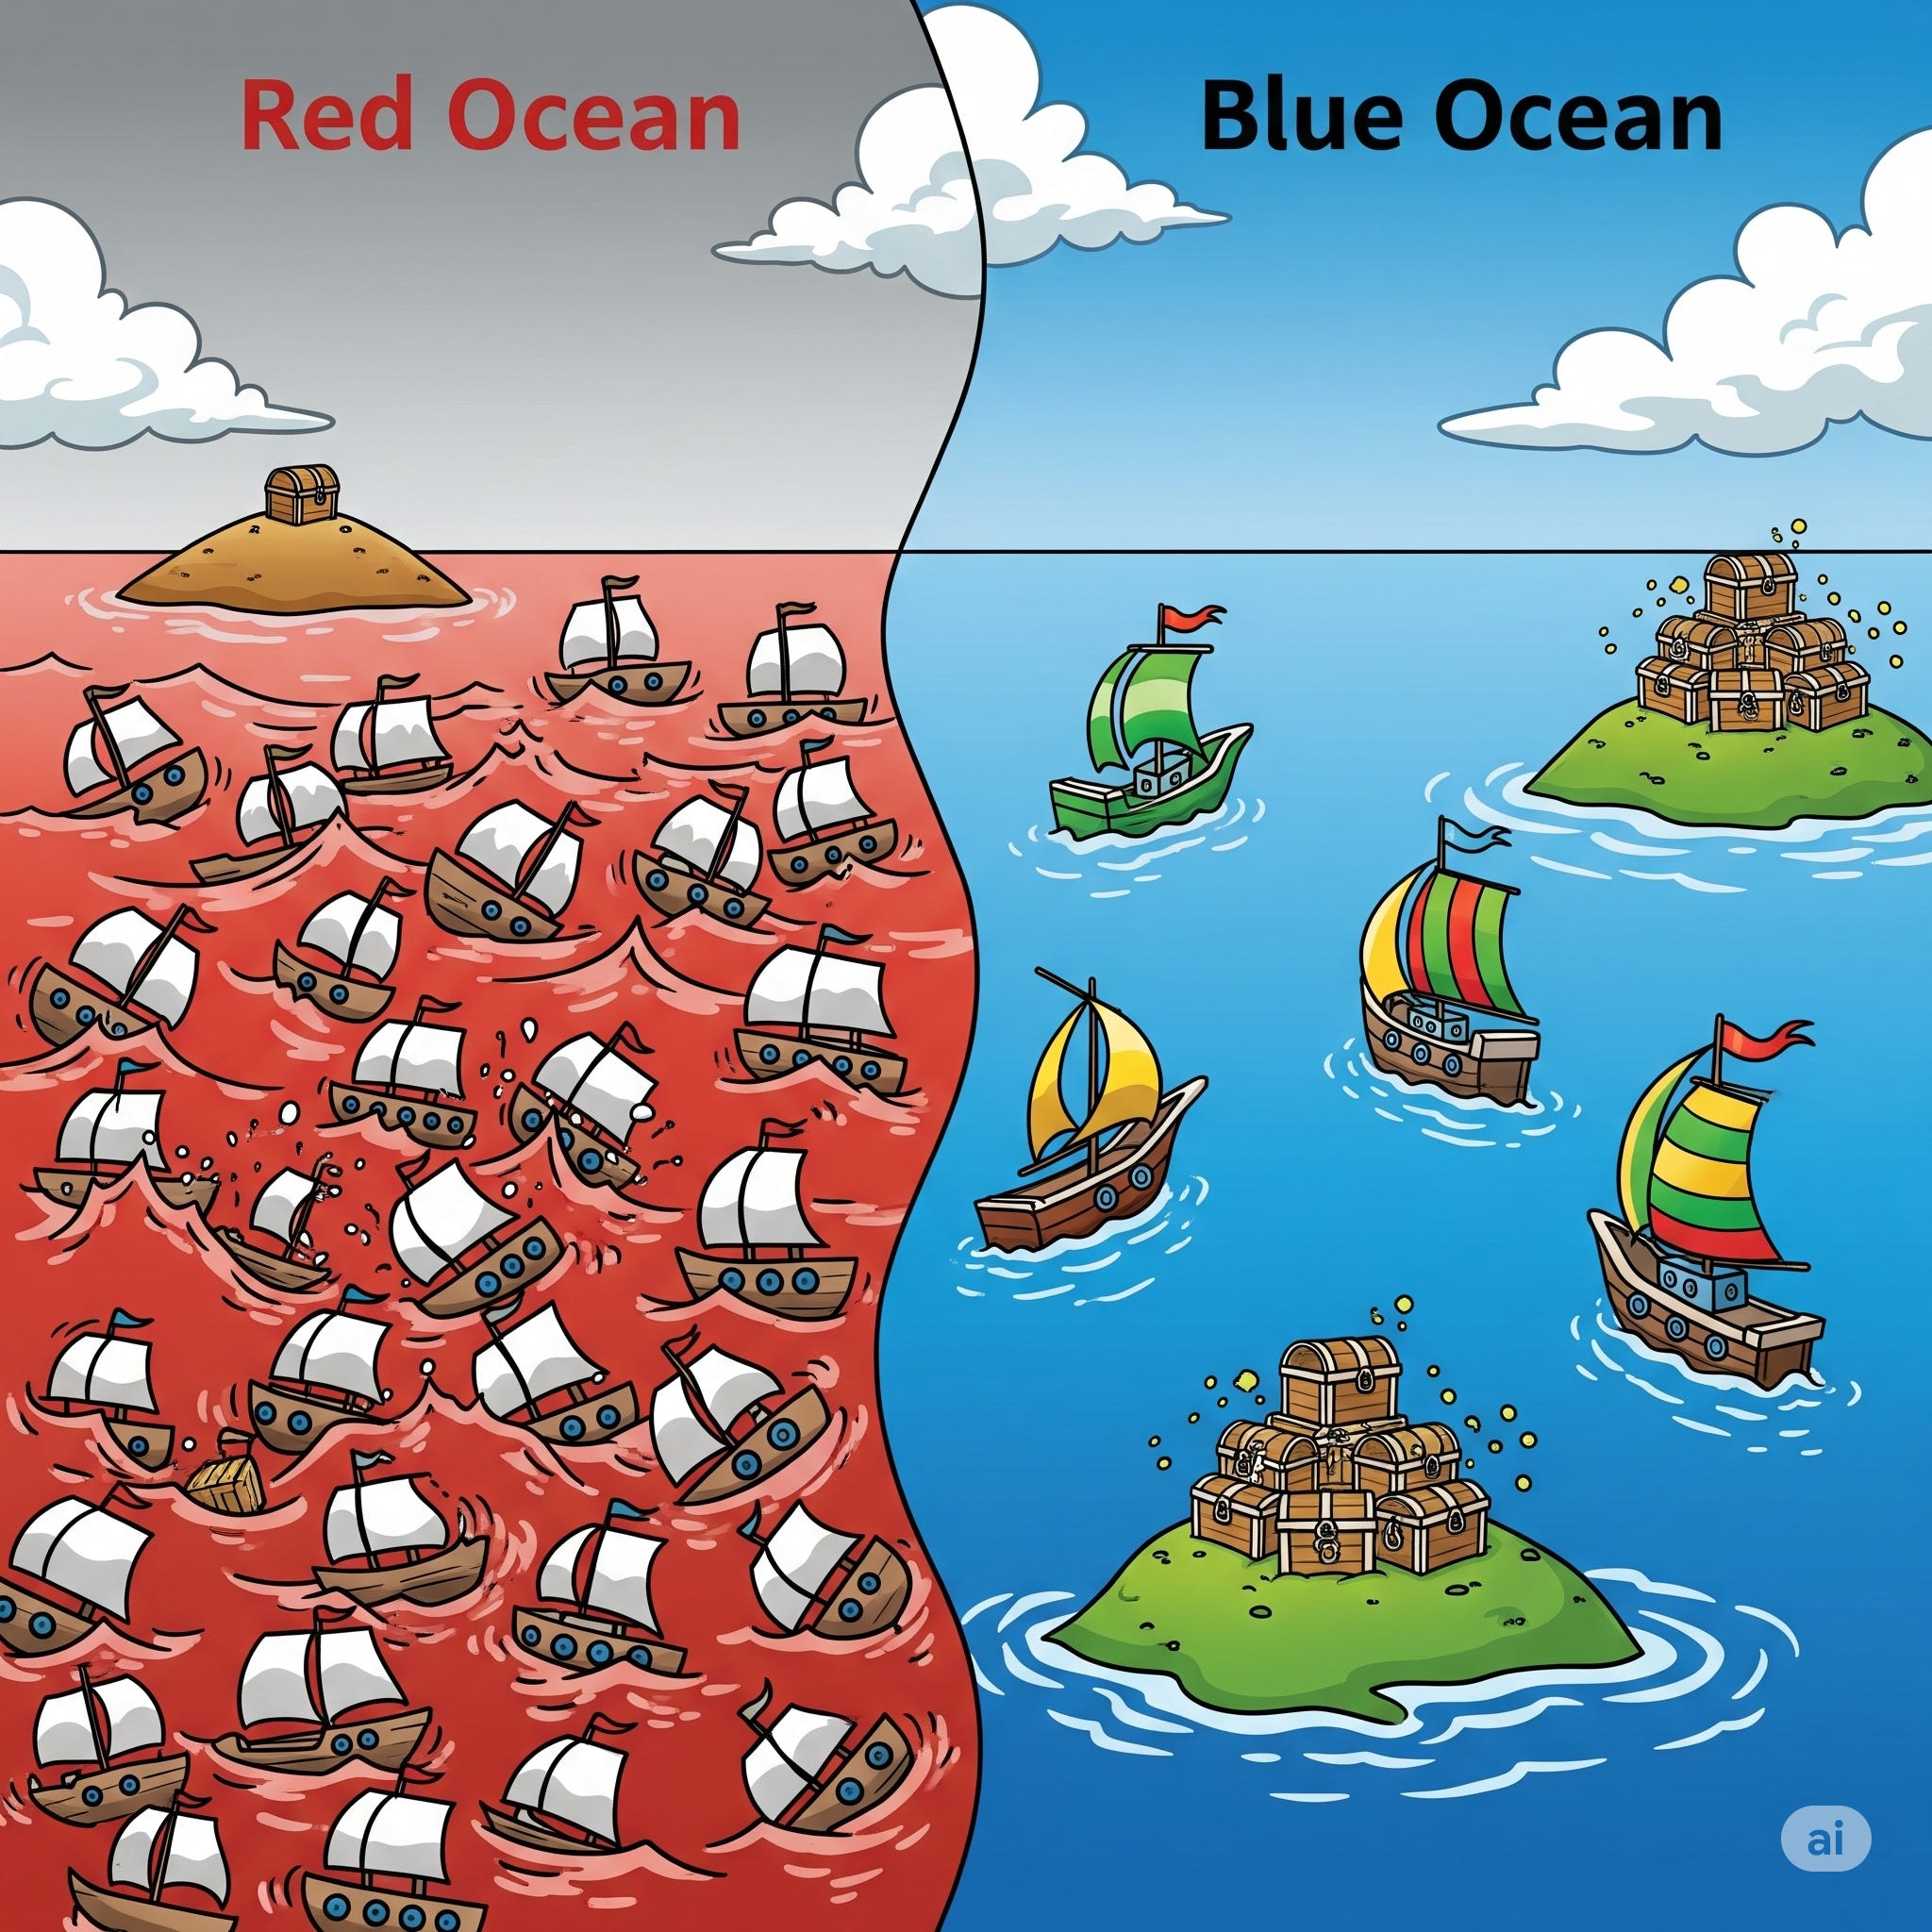
Blue Ocean / Red Ocean
These terms describe how competitive a market is.
Imagine the business world as vast oceans where companies swim. A red ocean is full of fierce competition — companies fight over the same customers, often by lowering prices or copying each other, like sharks in bloody water.
A blue ocean is a new or uncontested market space, where there’s little to no competition because you’ve created a new market by innovating and offering something unique, making competition irrelevant and opening up fresh opportunities for growth.
Examples:
Uber and GetTaxi (ride-sharing apps) were a blue ocean at first.
Spotify and Netflix created a Blue Ocean by shifting from buying individual songs and renting movies to unlimited access, leaving traditional music and video stores in the Red. Today they have more competition, but they are still the leaders thanks to their head start.
Equilibrium
In economics, equilibrium is the sweet-spot when supply (how much is available) and demand (how much people want) are perfectly balanced, keeping prices stable without shortages or surpluses.
It's like a market's natural resting point; if something disrupts it, like a sudden shortage, prices might rise until things balance out again.
This concept helps explain why gas prices fluctuate based on global events, aiming to return to a steady state.
Most examples out there will often use a farmers’ market where the number of apples exactly matches how many people want to buy. (classic and healthy)

Opportunity Cost
Ever had to choose between pizza or a movie, knowing you can't have both? Opportunity cost is the value of what you give up when you pick one option over another. It's the hidden price of your choice. In other words, every choice has a trade-off.
It’s not always about financial cost, it’s about trying to measure the trade-off between two (or more) potential decisions.
For instance, if you spend your evening watching TV, the opportunity cost might be the fun or progress you could’ve had meeting friends or working on a project, or skipping a vacation to buy a new gadget.
In business, it can be the decision for the company to pivot, or to invest money on Capex (as going full power on AI or invest in new equipment), choosing where to focus your time and resources, but remember that sometimes doing nothing is also the right decision for the company.
Monopoly / Oligopoly
A monopoly happens when one company completely controls a market, with no real competition (e.g., a local water supply).
An oligopoly is when a small number of companies dominate the market (e.g., commercial airlines or smartphone makers). They might compete a bit but can still influence prices together.
Why Monopoly / Oligopoly Can Be Dangerous
When only one (monopoly) or a few (oligopoly) companies control a market, they can raise prices, reduce product quality, slow innovation, and limit choices — because customers have nowhere else to go. It also makes it harder for new competitors to enter the market. Eventually without competition there will be less and less innovation for that specific service or industry. But it usually does not last forever, and innovation eventually wins, or the lawmaker interferes.
Few examples from the near past: Google Search, MS Office (Word, Excel, PowerPoint).
When It Can Be Good or Necessary
Some industries work better with fewer players because of huge costs or infrastructure needs — for example, electricity grids, railways, or water supply. In these cases, a monopoly or oligopoly can be efficient and ensure stable service, but it usually needs regulation to protect consumers.
That’s where governments need to take actions, from financing or subsidising companies in specific industries, but also to set limitations. And as you can imagine, it’s a pandora box for many potential problems (from inefficiency to politicization), but one thing we learned for sure is that governments are simply not good at running companies.

Strategy vs. Tactics
Some of you probably heard these terms when you watched sports, but now let’s try to explain it better, and maybe you’ll understand the coach better.
Strategy is the big-picture plan, what you want to achieve and why. This is about the overall goals and direction, focusing the long run
Tactics are the specific actions, it’s about how you’ll get there. It’s the short-term actions that make the strategy happen.
In business, a strategy might be expanding to new customers, while tactics could include targeted ads or sales promotions;
In football (soccer, not US football), a strategy could be winning the game by controlling possession and wearing the opponent down. The tactics might be playing short passes between midfielders, using overlapping runs on the wings, and pressing high to quickly win back the ball. (very specific, I know, yet it’s still a great example)

Balance Sheet
One of the 3 main financial statements for a public company. The balance sheet is a financial snapshot of a company at a specific point in time (a quarter, a year). It shows what the company owns (assets), what it owes (liabilities), and the leftover value for owners (equity). It lists a company's assets (like cash or equipment), liabilities (debts), and equity (owner's stake), helping you see if the business is financially healthy.
Although it exists for public investors (like your and me who can invest directly in stock, or institutional companies that invest our pension in stocks) so we all can analyze it and get a sense of its real status, it’s usually a (really) long document full with tables and numbers, but you’ll be glad to know there are more user-friendly ways to examine the balance sheet, such as using a sankey chart.

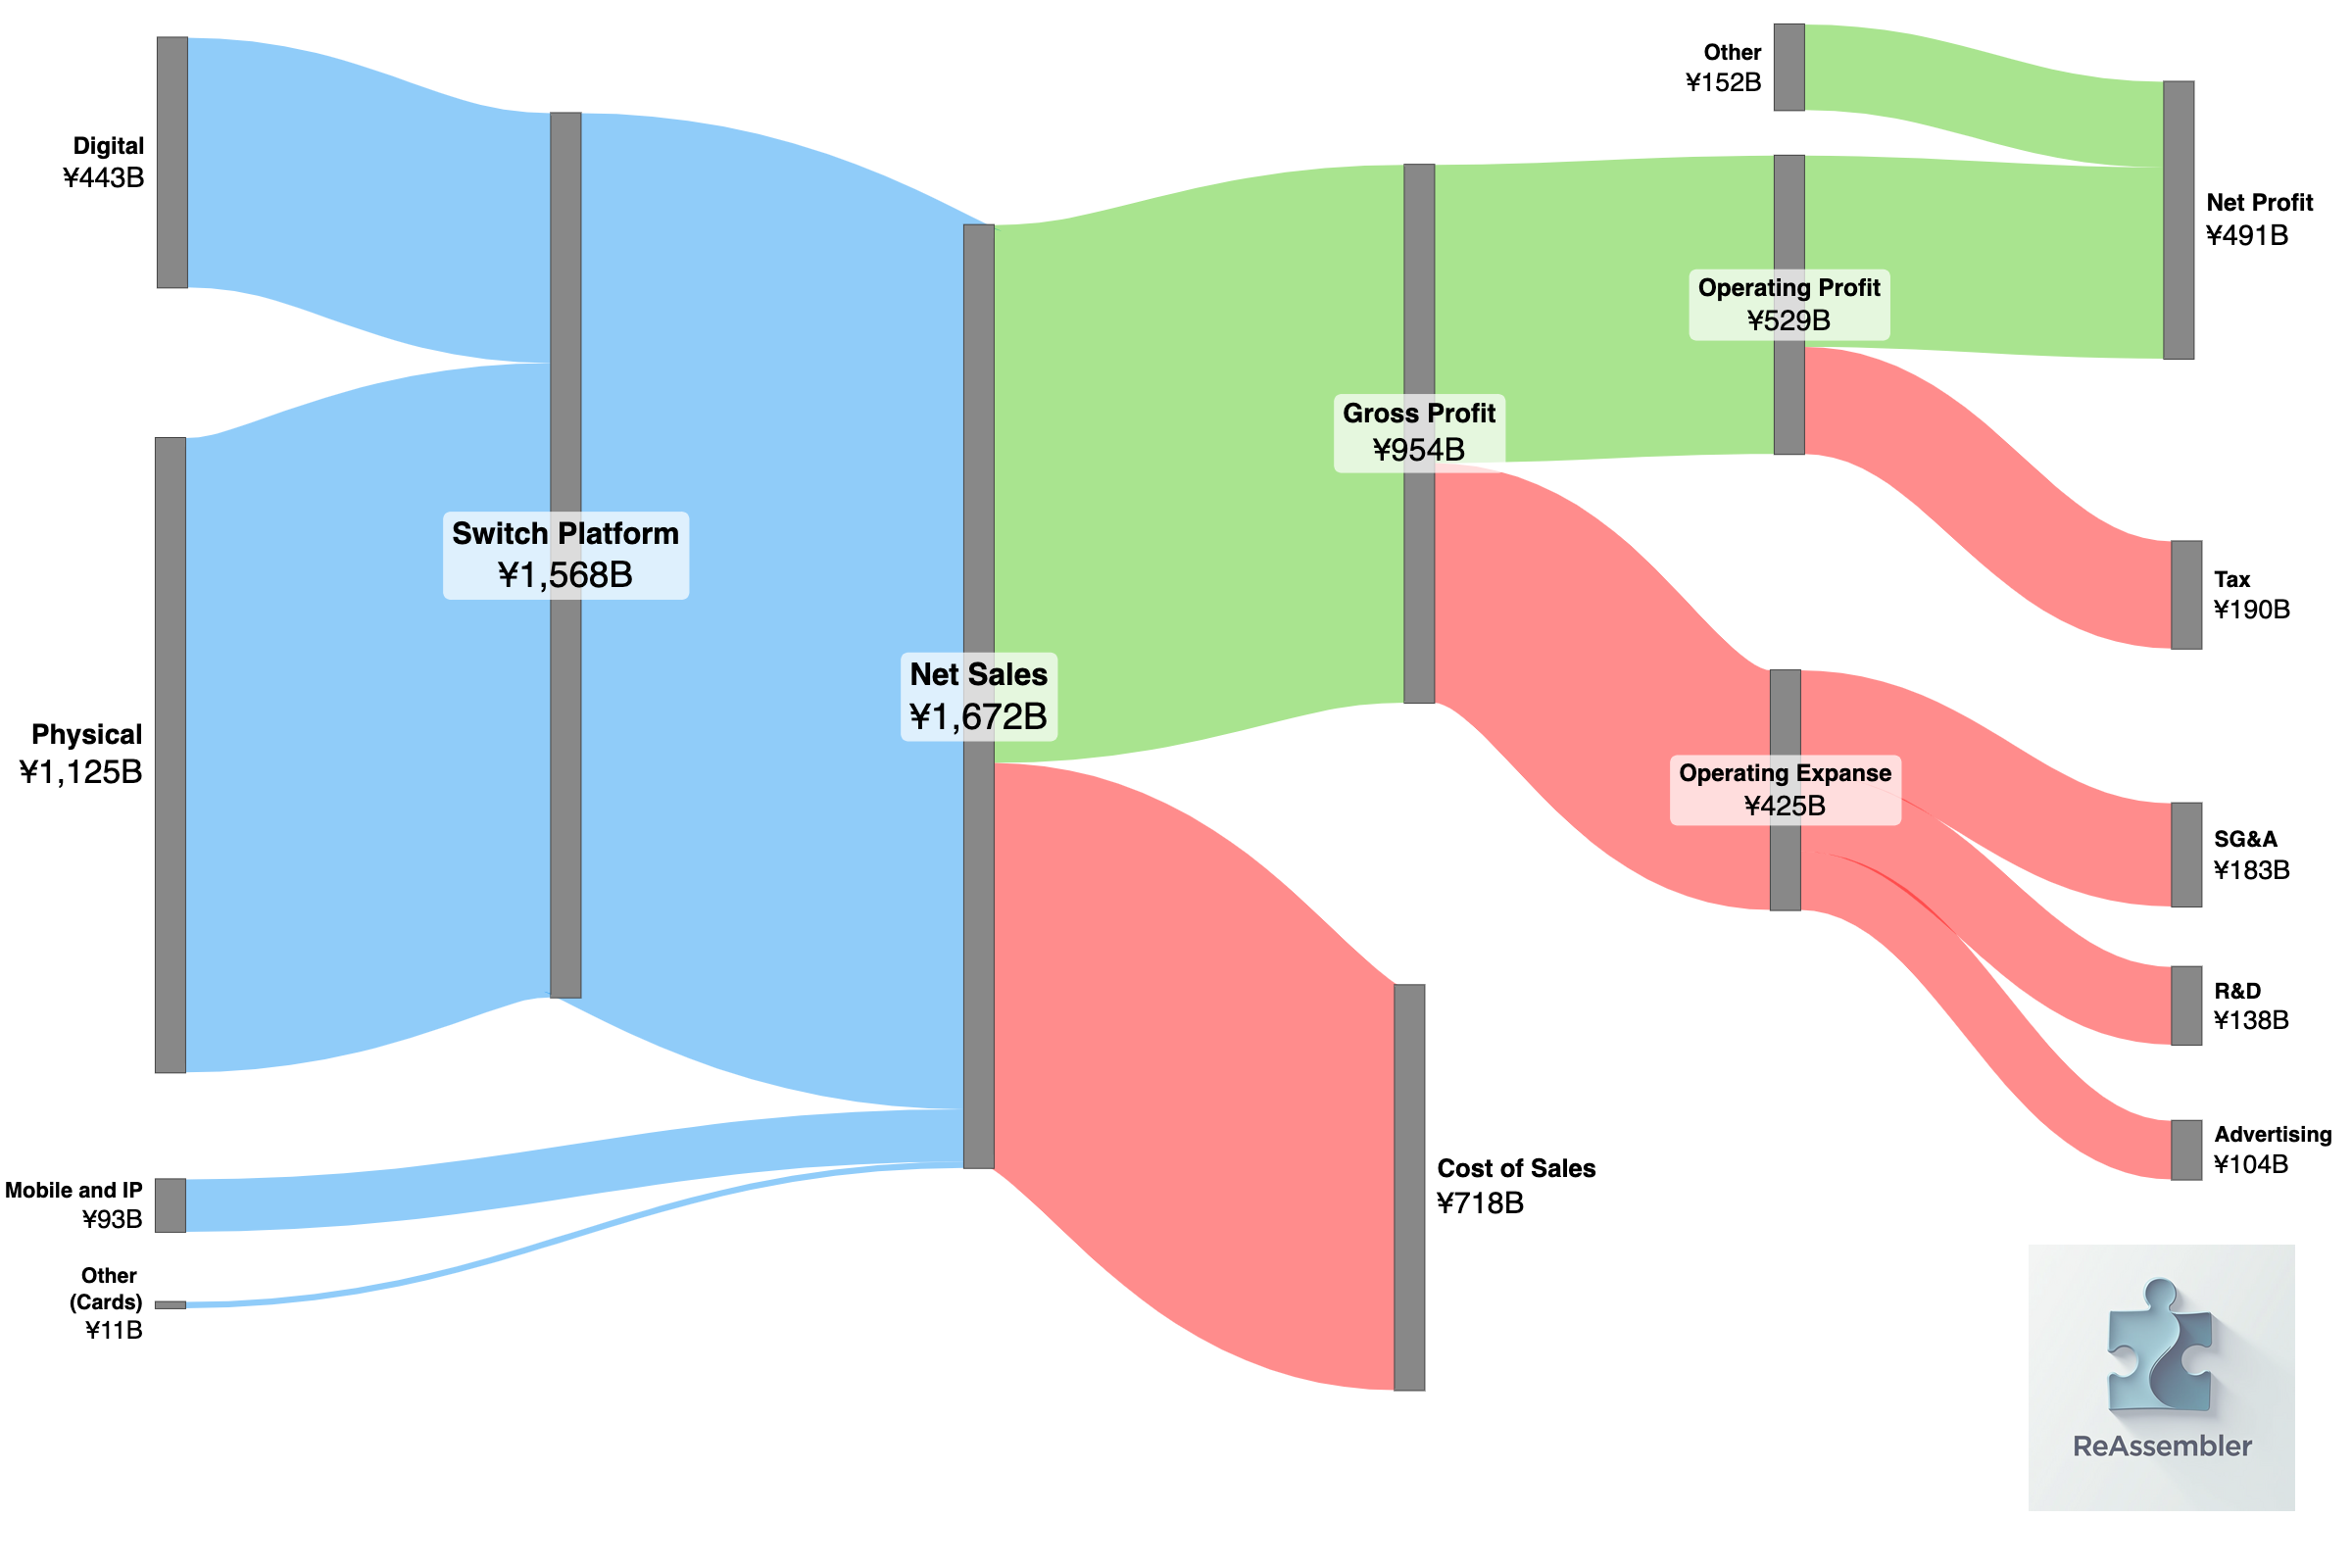
Income Statement
The income statement is a vital financial document for any publicly traded company, significantly influencing its stock price.
Think of an income statement as a comprehensive report card for a company's money-making over a period, like a month, quarter or year. It tallies up revenues (money coming in from sales), expenses and costs (money going out), and what's left as profit. It provides clear insight into whether the company is generating more revenue than it expends, offering a snapshot of its financial health and operational efficiency.
Just as with the balance sheet, the income statement is also a challenging document for any unskilled person, but as before, there are ways to get a glimpse of the numbers using solutions as a sankey chart (and also google-finance is doing a good job in simplifying some aspects of it).
Operating Margin / Net Profit Margins
Margins are about efficiency and profitability. Operating margin shows what percentage of sales is left after paying day-to-day operating costs (staff, rent, materials) but before taxes and interest. Net profit margin is what’s left after all costs, taxes, and interest — the true “take-home” profit.
These margin can be found within the income statement (see example above).
CAPEX (Capital Expenditures)
Money a company spends to buy or upgrade long-term assets like factories, machines, or software systems (or new server farms with lots of Nvidia AI chips).
It's not everyday expenses but major purchases that help the business expand or improve over time.
Market Cap (Market Capitalization)
The total value of a company’s stock — calculated as stock price × number of shares. It’s a quick way to size up a company, but it doesn’t account for debt or cash.It categorizes firms as small, mid, or large-cap, helping investors understand size and risk.
P/E Ratio / Multiple
You probably also heard the term “multiple” or “earning multiple”, which is the same thing.
The P/E ratio (price-to-earning) is a quick way to see how “expensive” a company’s stock is. It’s calculated by dividing the stock price by the company’s earnings per share. A high P/E ratio often signals that investors expect strong future growth. A low P/E might mean the stock is undervalued — or that little growth is expected — which can signal either a bargain or a risk.
Each industry tends to have its own typical P/E range, so comparing a company’s ratio to its peers can help spot outliers. These outliers may reveal potential opportunities or warning signs.
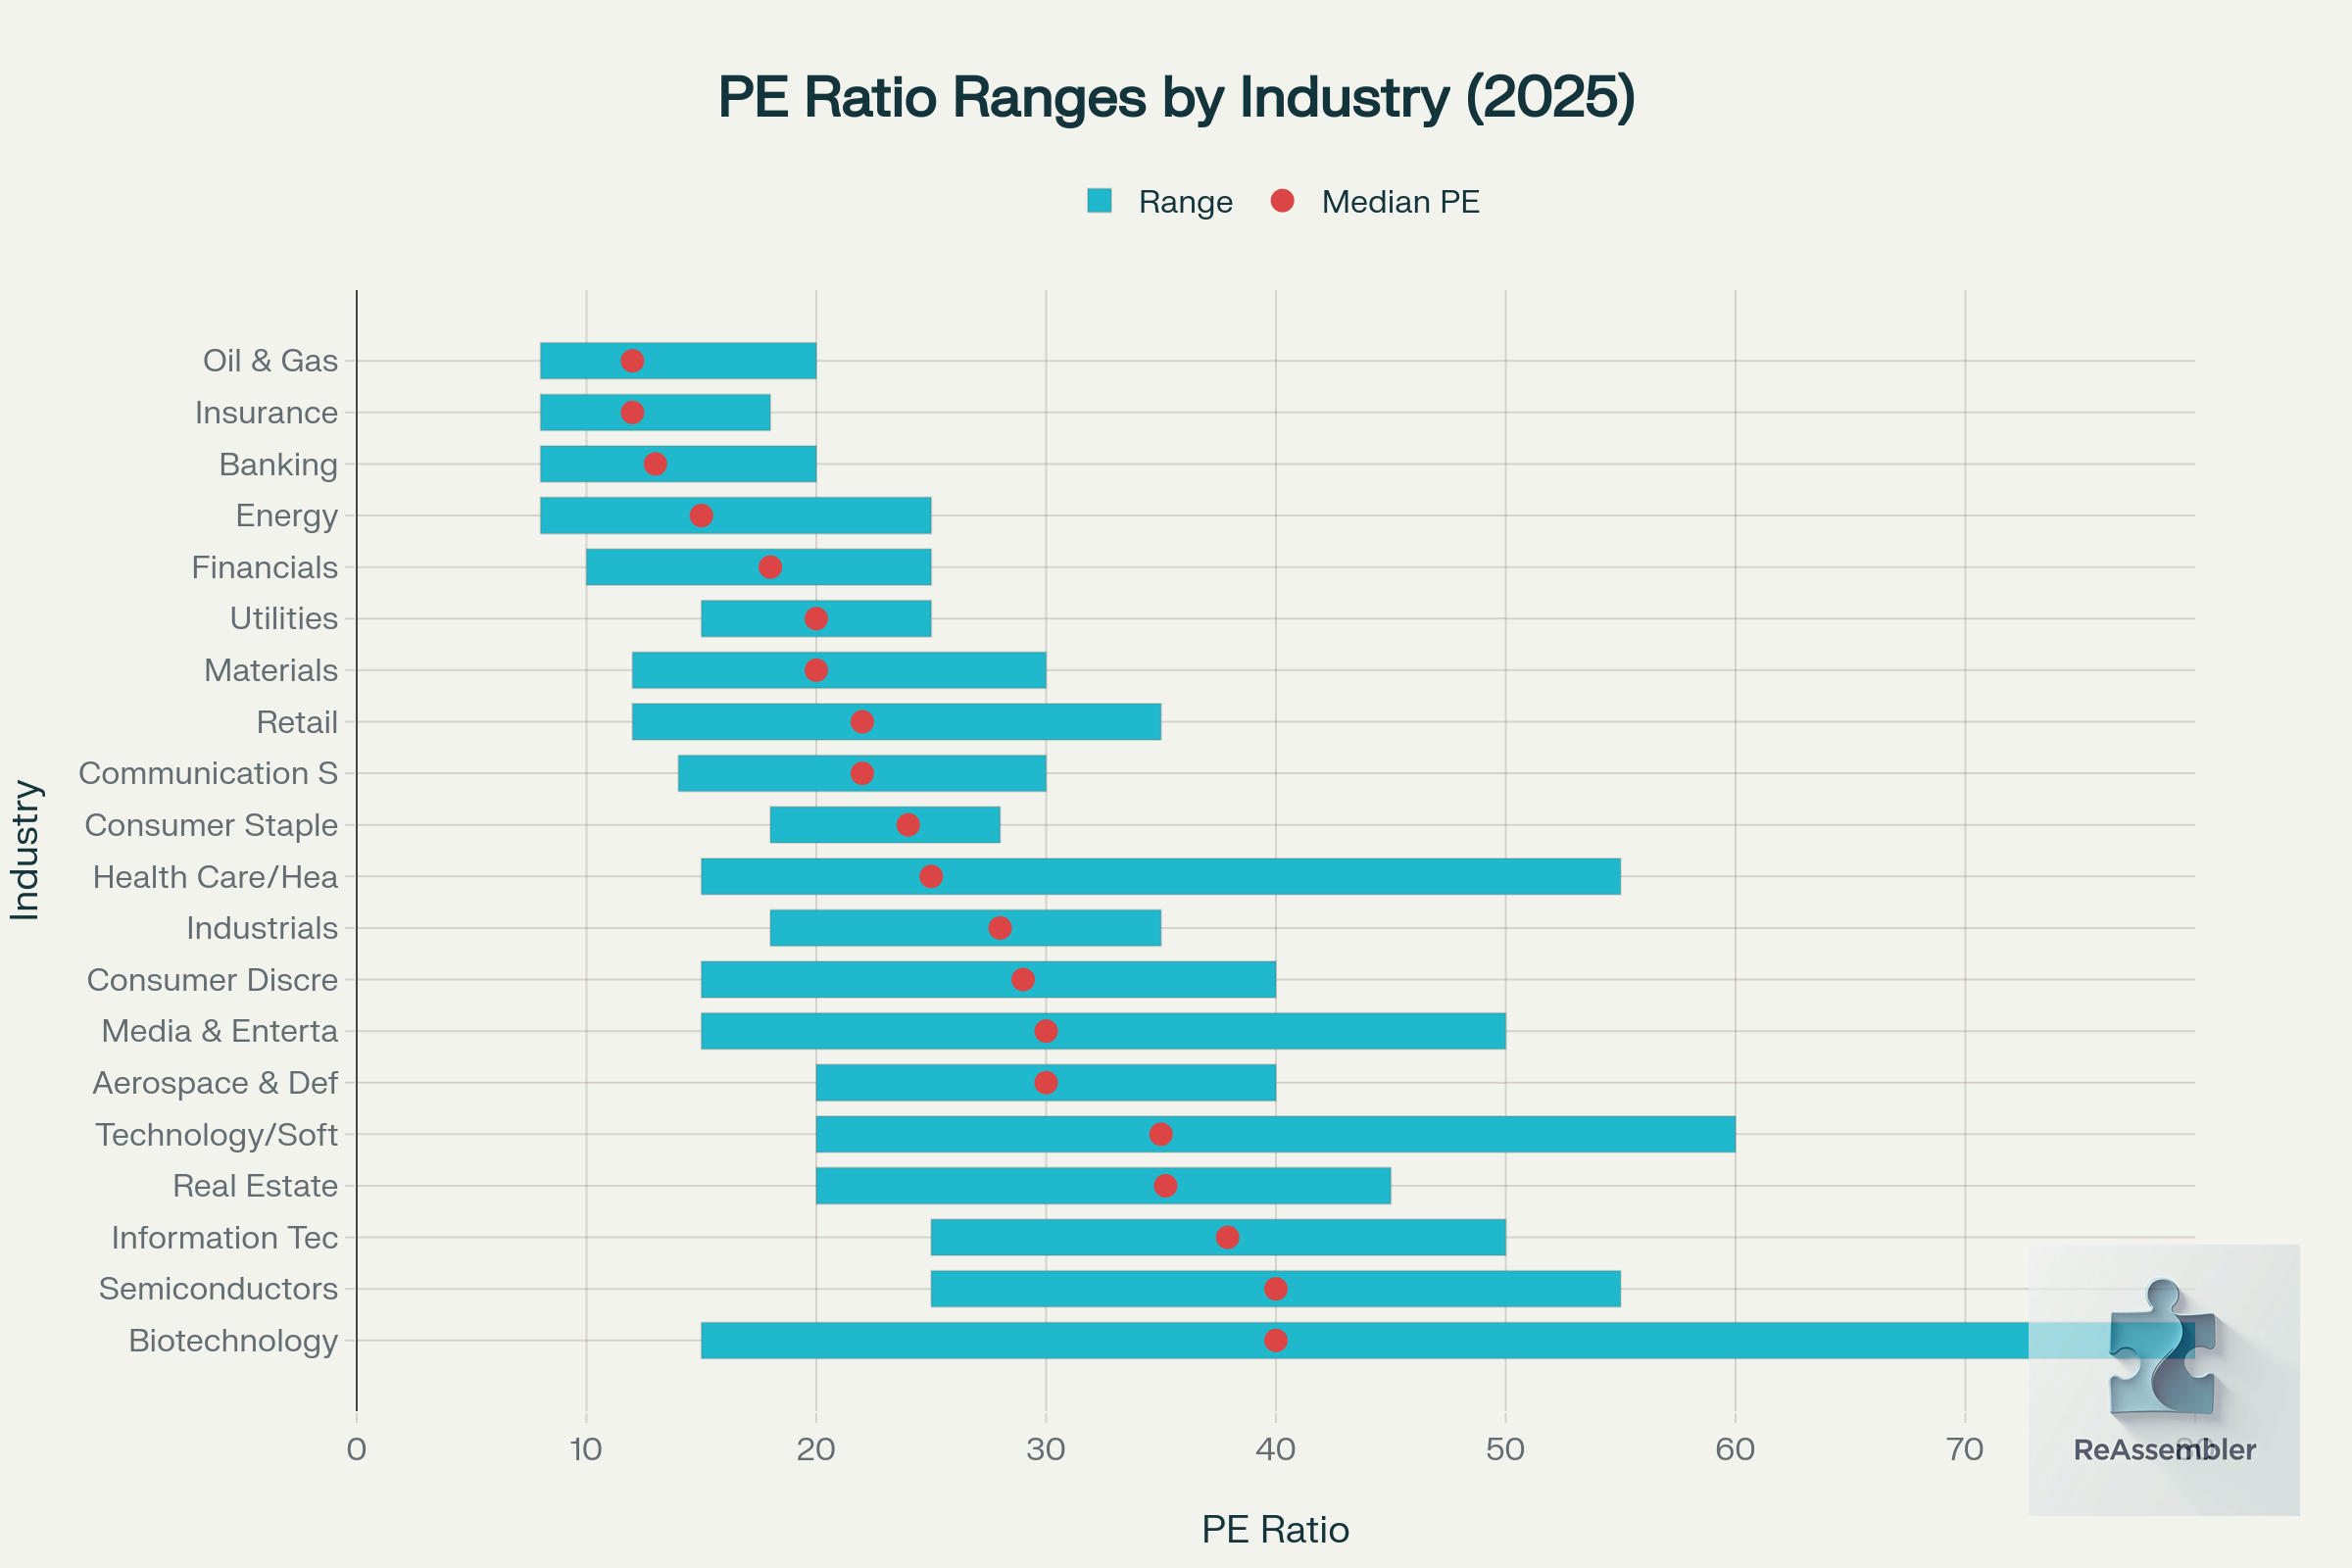
An example for anomaly (based on the 12 months before August 2025, Tesla’s P/E was 174–196, far above Ford (8–14), GM (5–8), Toyota (7), and Honda (6). Traditional automakers have steady valuations and lower margins, while Tesla’s high P/E reflects investor bets on its disruptive role in EV’s, autonomous driving tech, and (mainly?) just keep believing in Elon Musk to deliver his vision.
So do you think Tesla is a car company or not?

EBITDA
Short for Earnings Before Interest, Taxes, Depreciation, and Amortization. It’s a measure of a company’s profitability from core operations, ignoring costs that aren’t part of daily business. Useful for comparing companies without accounting quirks getting in the way.
Imagine evaluating two restaurants by their food sales minus ingredients, ignoring rent differences.
Book Value
What a company would be worth on paper if it sold all its assets and paid off all its debts. It’s an accounting measure, not necessarily what the market thinks the company is worth. For investors, it helps spot undervalued stocks if the market price is lower than this figure.
Enterprise Value (EV)
A way to measure what a company is really worth if you wanted to buy the whole thing. It starts with the market cap (value of all shares) but also adds the company’s debt and subtracts its cash. This gives a more complete picture than market cap alone because it includes what the company owes and what it already has in the bank.
This is what you'd really pay to buy the whole business outright. Unlike just stock value (market cap), it accounts for obligations, making it useful for mergers, and helps to compare companies daily, especially those with different levels of debt.